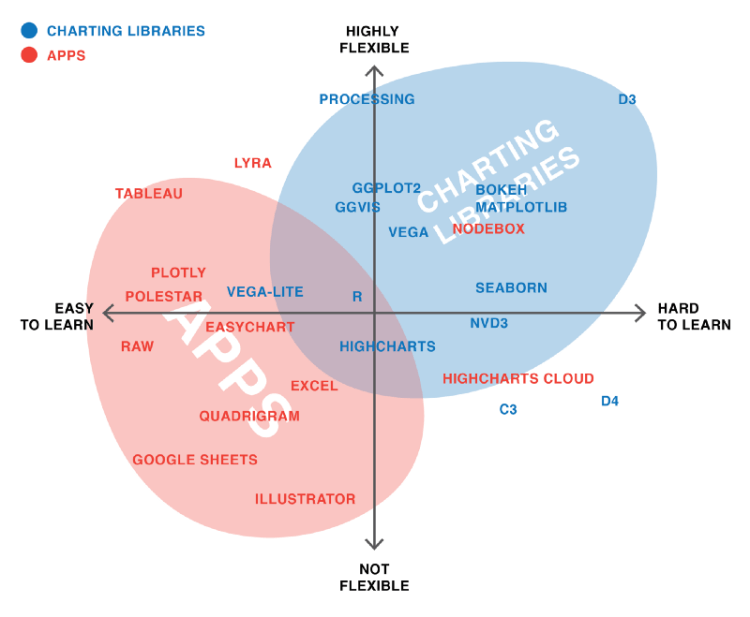
Lisa Charlotte Rost plotted the same data using 24 different visualization tools: you can read about her experience and suggestions in her excellent article with insightful figures.
Lisa Charlotte Rost plotted the same data using 24 different visualization tools: you can read about her experience and suggestions in her excellent article with insightful figures.
